Above average numbers of kokanee salmon are predicted to be available to spawn in the Metolius River and its tributaries during October, 2017. From 2009 – 2016, kokanee spawner population estimates have averaged approximately 180,000 and this year the number was forecasted to spawn was approximately 240,000. We will know now the accuracy of the forecast and this is covered at this link.
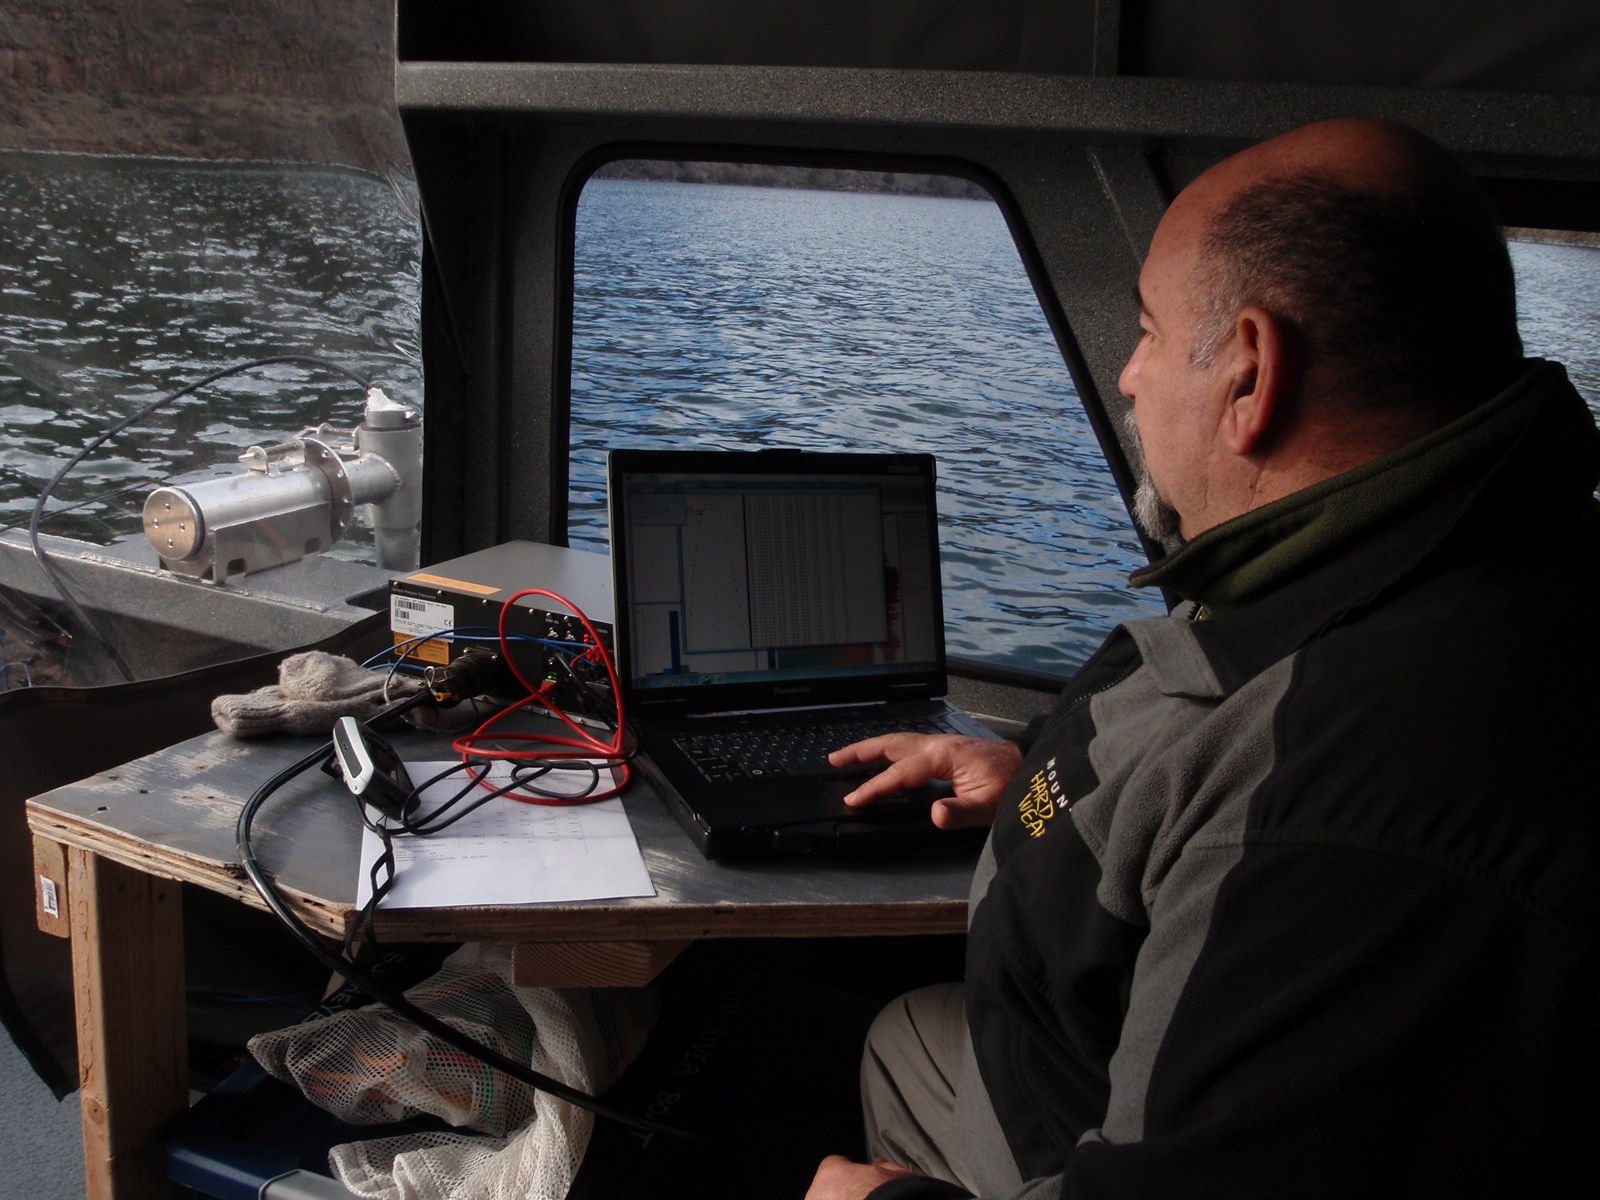
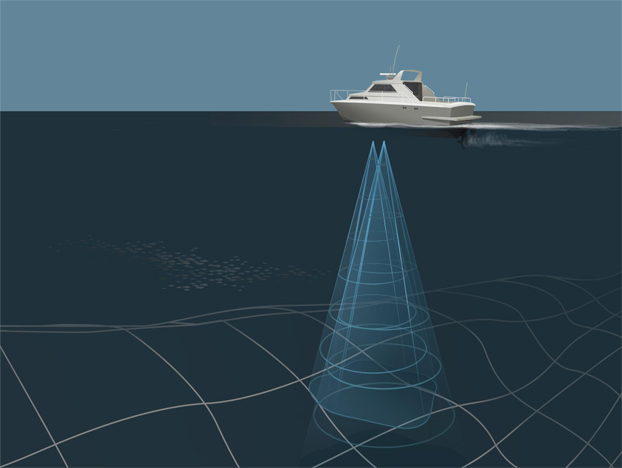
The 2017 prediction is based on data from ongoing Bonneville Power Administration-funded monitoring efforts to determine if these kokanee are a potential source for Sockeye Salmon re-introduction in the Deschutes River Basin. Sockeye salmon and kokanee, often referred to as land-locked sockeye salmon, and are the same fish species (Oncorhynchus nerka) that behave differently. For example, sockeye salmon swim to the ocean where they spend one or two years before returning to their natal stream or lake to spawn, and kokanee spend their entire life in a lake. Both types of the fish die after spawning one time. To make the prediction, data from two monitoring efforts were used. First, hydroacoustic (sonar) surveys of LBC are conducted every summer and winter by the Confederated Tribes of the Warm Springs Reservation fisheries research department to estimate the number of fish in the limnetic zone of the lake (see Figures 1 & 2 below). The limnetic zone is the open water area that is away from shore, well lit, and dominated by plankton upon which kokanee feed. Second, a mark-recapture study is conducted every year by the Tribes, Oregon Department of Fish and Wildlife and Portland General Electric to estimate the number of Lake Billy Chinook kokanee that spawn in the Metolius River and tributaries.
We are seeing that sonar survey population estimates for medium sized (7.5 to 16 inches) limnetic fish from 2009 to 2016 and mark-recapture study estimates from 2010 to 2016 are relatable (see Figures 3 & 4). Corresponding sonar and mark-recapture population estimates are offset by one year. For example, the 2009 sonar estimate corresponds to the 2010 mark-recapture population estimate. Also, sonar estimates average 60% more fish (range 35 – 80%) than mark-recapture estimates due to mortality of fish during the eight to eleven months between estimates. Such mortality includes predation by other fish, such as trout, and being harvested by anglers. Both charts show a similar trend in estimated populations beginning with three similar years, the lowest estimate among years, a one year increase and another increase in the two most recent years (three most recent years if the forecast is correct). As you see, the numbers can vary a lot, which is common among kokanee populations everywhere.

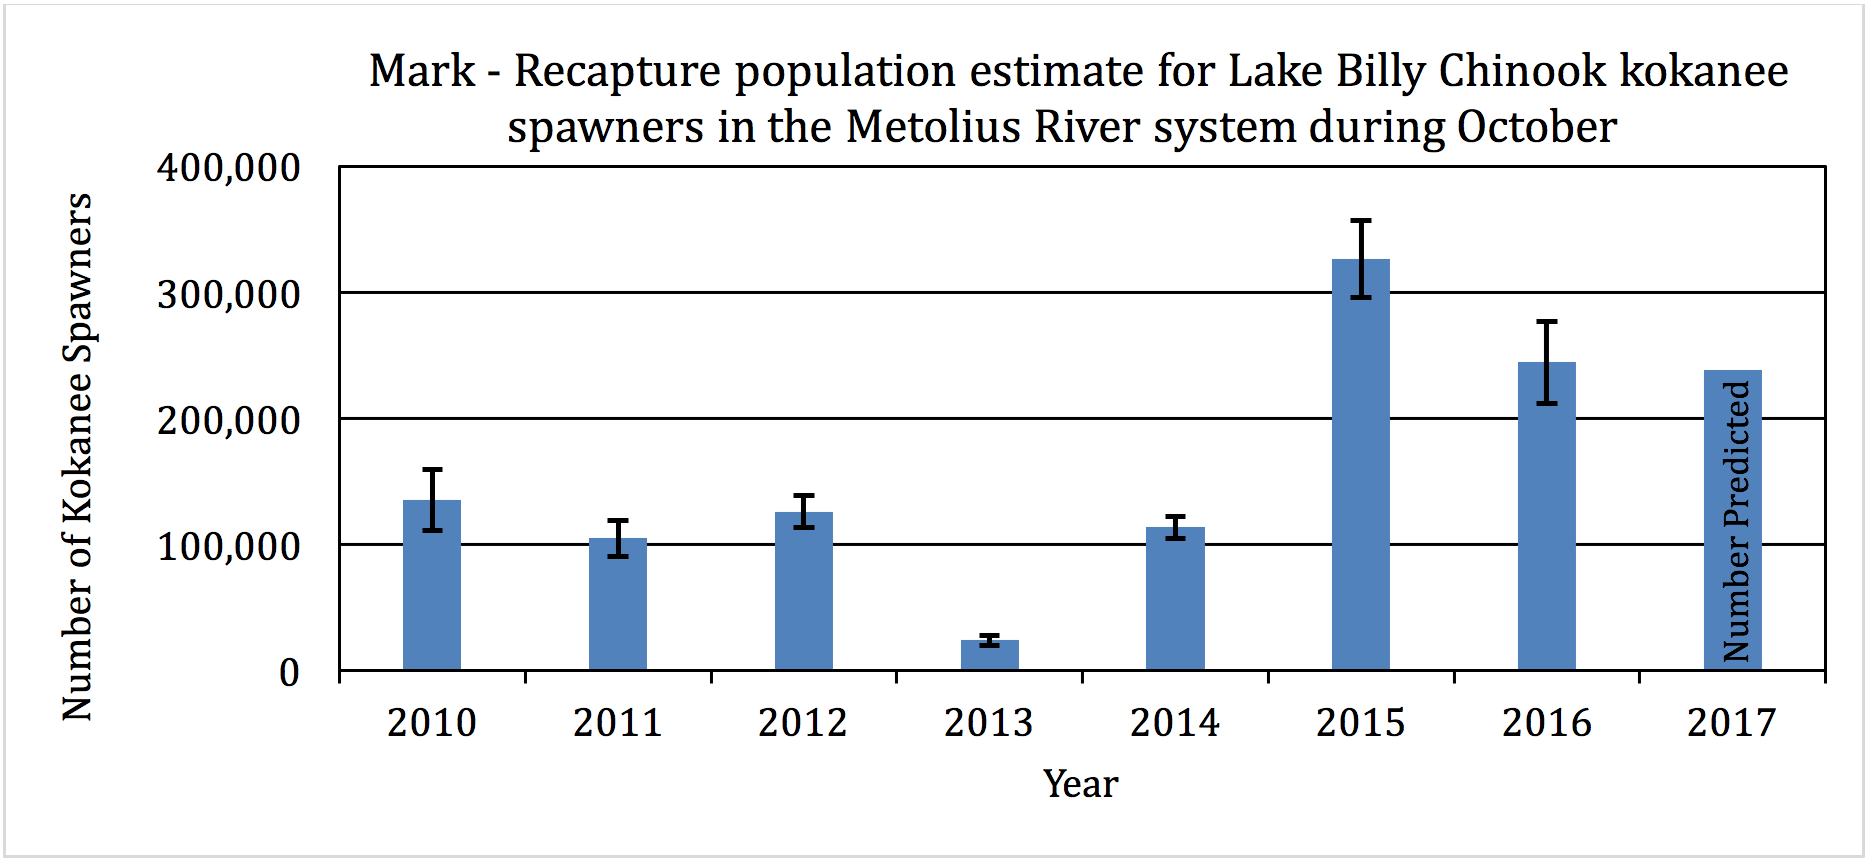
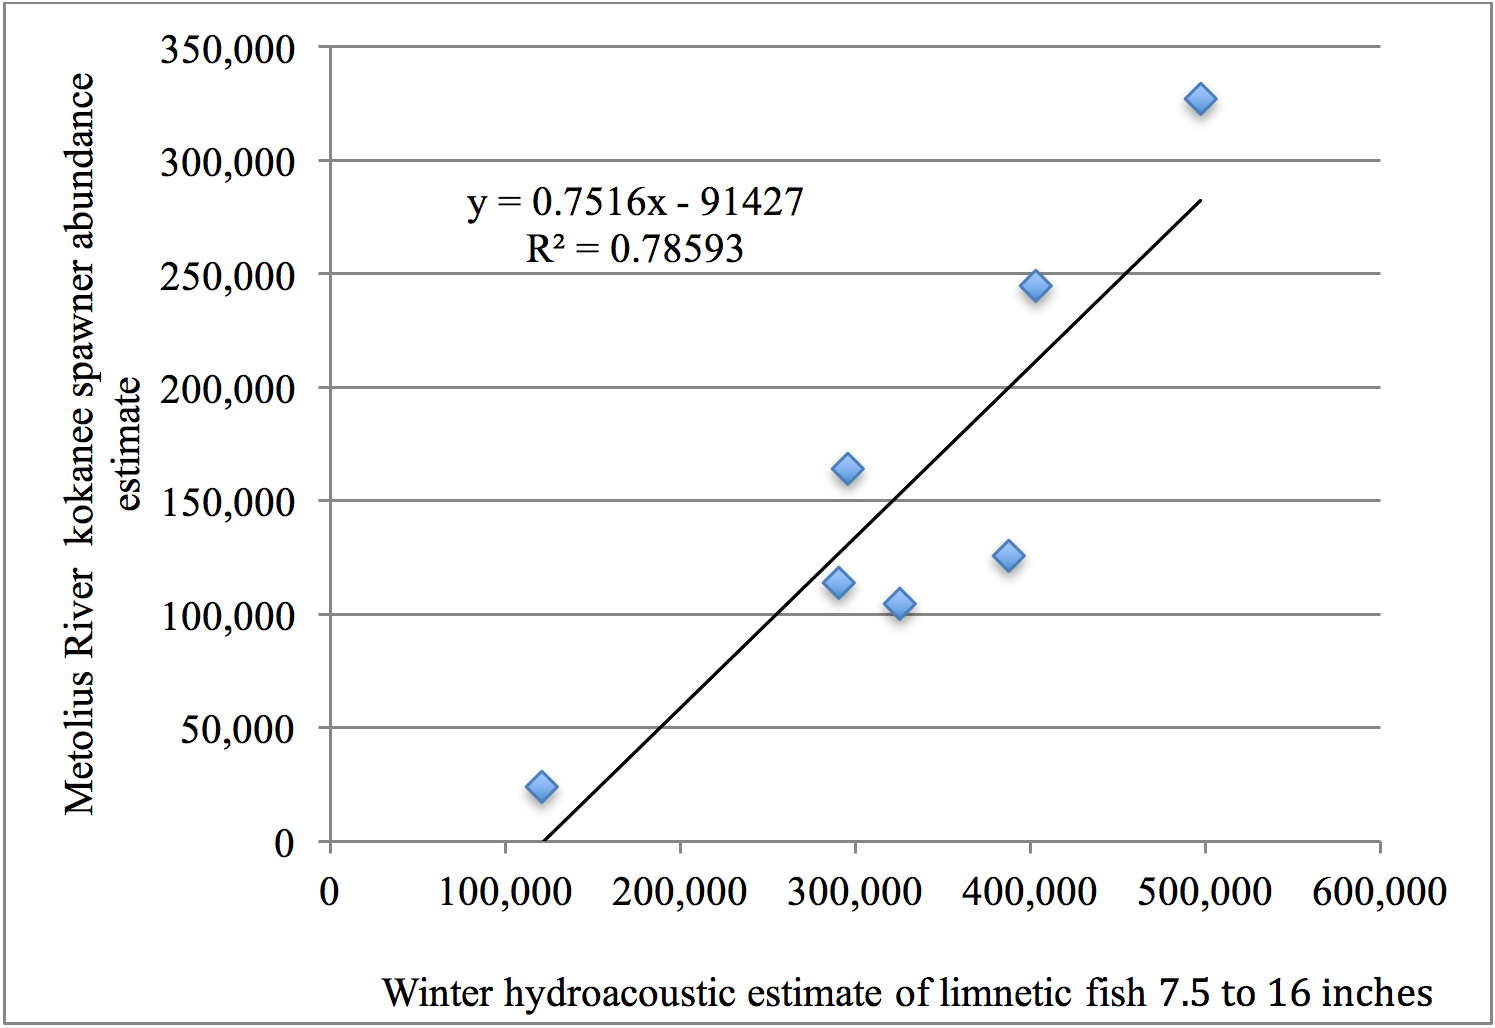
Figure 5 shows combined results from the two data sets. Each dot on the graph represents one year’s winter sonar medium sized fish population estimate and the next year’s summer-fall mark-recapture kokanee spawner population estimate. The best-fit line (y = 0.7516x – 91427) through all points is calculated and the association between all points is described by an R² value of 78% (if all points were on the line the R² value would be 100%). Last winter’s (November 2016) sonar population estimate of medium sized limnetic fish was used in the equation (x = 438,996) to predict that 238,512 kokanee will be available to spawn in the Metolius River and its tributaries during October, 2017.
Having information about the Lake Billy Chinook fish populations allows for informed management decisions about sockeye salmon reintroduction efforts. For example, sonar data we collect this winter will be an indication of the number of young kokanee that may be passed downstream during operations at Lake Billy Chinook and Round Butte Dam smolt passage facilities during spring 2018 and allow managers to effectively plan for those operations.
We thank our project collaborators Portland General Electric and Oregon Department of Fish and Wildlife as well as the Bonneville Power Administration.